


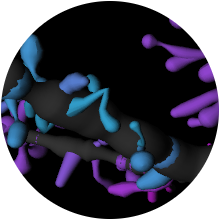
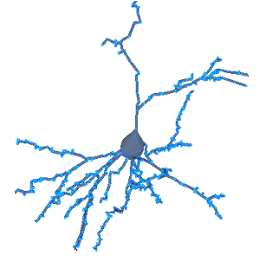
A new tool to interactively explore and reveal the detailed organization of the microanatomy of pyramidal neurons.
Active projects
-
MATDAH: TUTOR VIRTUAL DE MATEMÁTICAS
Una plataforma interactiva para niños con TDAH
- Line A: Emerging Doctors funded by the agreement signed between the Community of Madrid and the URJC for the promotion and encouragement of research and technology transfer during the period 2023-2026
- Duration: Nov 2024 - Nov 2026

Recent past projects
-
Visual Analytics-based horizontal tools for DIgital science and Society (MEDAVI)
- Funding agency: Proyecto PID2020-113013RB-C21 financiado por:
- Duration: 2021-2025
-
EBRAINS
- Funding agency: European Commission.
- Duration:SGA2: Sept 2022 - March 2025
-
Human Brain Project web
- Funding agency: European Commission. H2020 FET Flagship Project
- Tasks: RUP 7.3.2, SGA1-T7.3.2, SGA1-T1.4.2, SGA2-T1.4.4, SGA2-T7.3.8, SGA2-T7.3.9
- Duration:
- RUP: September 2013 - March 2016
- SGA1: April 2016 - March 2018
- SGA2: April 2018 - March 2021
-
Cajal Blue Brain web
- Funding agency: Ministerio de Ciencia e Innovación
- Duration: 2009 - 2019
-
VIANA: VIsualización ANalítica Avanzada
- Funding agency: Ministerio de Economía y Competitividad (MINECO)
- Duration: Jan 2018 - Dec 2020
-
CeBMI: UNIVERSITY-INDUSTRY EDUCATIONAL
CENTRE IN ADVANCED BIOMEDICAL AND MEDICAL INFORMATICS
(KNOWLEDGE ALLIANCE) web
- Funding agency: European Commission. Erasmus+
- Duration: January 2020 - December 2022
- Objective: Development of an educational Centre in advanced Biomedical and Medical Informatics. The centre will use new innovative cloud-based technology to support the creation and delivery of new courses in BMI, which is a very dynamic field undergoing rapid evolution and centrally featured in health reforms across Europe.
-
NAVAN: Nuevos Avances en Visualización Analítica
- Funding agency: Ministerio de Economía y Competitividad (MINECO)
- Duration: Jan 2015 - Dec 2017 (Extended until Jun 2018)
- RASimAs web


For a full list of past projects you can follow this link
Tools
NeuroScheme
NeuroScheme is a tool that allows users to navigate through circuit data at different levels of abstraction using schematic representations.

MSPViz
MSPViz is a new tool for for the analisys of structural plasticity models using abstract levels and a set of views composed by schematic representations on each level.

NeuroTessMesh / NeuroLOTs
NeuroTessMesh / NeuroLOTs is a set of tools and libraries that allow creating neuronal meshes from a minimal skeletal description.

ViSimpl
ViSimpl integrates a set of visualization and interaction tools that provide a multi-view visual analysis of brain simultation data.

MeLVin
MeLVin is a web-based tool that integrates a meta-descriptive language and a visual environment for coordinated view application design.
ClInt Explorer
ClInt Explorer is an application that uses supervised and unsupervised learning techniques to cluster neurobiological dataset.
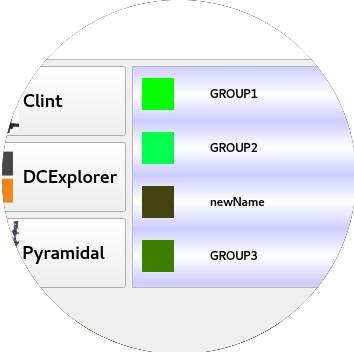
Vishnu
Vishnu tool provides information integration and storage from multiple sources, specimens and scales. Vishnu provides an interface to query, filter and extract the stored data to be explored with the integrated analysis applications: DC Explorer, Pyramidal Explorer and ClInt Explorer.
Projectional Radiograph Simulator
This simulator provides a safe environment where the procedure can be rehearsed, reducing all kinds of radiological risk to the patient or even the radiographer.
NeuroEditor
NeuroEditor is a software tool for the visualization and edition of morphological tracings that offers manual edition capabilities together with a set of algorithms that can automatically identify potential errors in the tracings.

Neuronize
Neuronize is a software tool for the interoperability between neuronal mesh representation (Imaris) and tracing representation (Neurolucida)

DeepSpineNet
DeepSpineNet is a GUI application for semiautomatic reconstruction of dendritic shafts and spines from microscopy images.
Libraries
-
FiReS: property management for Filtering, Retrieval and Search
-
NeuroLOTs: Libraries and tools for generating neuronal meshes
- Description: NeuroLOTs is a set of libraries and tools for generating neuronal meshes and for visualizing them at different levels of detail using GPU-based tessellation. Providing tools for the generation of 3D polygonal meshes that approximate the membrane of neuronal cells, from the morphological tracings that describe the morphology of the neurons. The 3D models can be tessellated at different levels of detail, providing either homogeneous or adaptive resolution along the model. The soma shape is recovered from the incomplete information of the tracings, applying a physical deformation model that can be interactively adjusted.
- Links:
-
nsol: neuroscience objects library
-
scoop: simple color palettes and mappers
-
ReTo: Render auxiliary Tools
Publications
Latest publications
- Ivan Velasco, Juan J. Garcia-Cantero, Juan P. Brito, Sofia Bayona, Luis Pastor and Susana Mata "NeuroEditor: a tool to edit and visualize neuronal morphologies," Frontiers in Neuroanatomy, vol. 18, 2024. DOI: 10.3389/fnana.2024.1342762
- María J. Gisbert, Aaron Sújar, Gonzalo Nicolas-Barreales, Alejandro Quesada-López, Sofia Bayona and David Delgado-Gómez "Designing interactive, gamified learning environments: a methodological approach with a case study on statistical quality control," Multimedia Tools and Applications, vol. 83, pp. 86999-87017, November 2024. DOI: 10.1007/s11042-024-19805-5
- Chao Li, David Delgado-Gómez, Aaron Sujar, Ping Wang, Marina Martin-Moratinos, Marcos Bella-Fernández, Antonio Eduardo Masó-Besga, Inmaculada Peñuelas-Calvo, Juan Ardoy-Cuadros, Paula Hernández-Liebo and Hilario Blasco-Fontecilla "Assessment of ADHD Subtypes Using Motion Tracking Recognition Based on Stroop Color–Word Tests," Sensors, vol. 24, 2024. DOI: 10.3390/s24020323
- Jesus Mayor, Laura Raya, Sofia Bayona and Alberto Sanchez "A virtual reality perceptual study of multi-Technique redirected walking method," IEEE Transactions on Emerging Topics in Computing, pp. 1-10, 2024. DOI: 10.1109/TETC.2024.3471249
- Lucía Caselles-Pina, Aaron Sújar, Alejandro Quesada-López and David Delgado-Gómez "Adherence, frequency, and long-term follow-up of video game-based treatments in patients with attention-deficit/hyperactivity disorder: A systematic review," Brain and Behavior, vol. 13, pp. e3265, 2023. DOI: 10.1002/brb3.3265
- Jamie Lea Pointon, Tianci Wen, Jenna Tugwell-Allsup, Aaron Sújar, Jean Michel Létang and Franck Patrick Vidal "Simulation of X-ray projections on GPU: Benchmarking gVirtualXray with clinically realistic phantoms," Computer Methods and Programs in Biomedicine, vol. 234, pp. 107500, 2023. DOI: 10.1016/j.cmpb.2023.107500
- Elena Peribañez, Sofia Bayona, Jose San Martin, Ana Verde, Carlos Garre, Janika Leoste and Luis Pastor "An Experimental Methodology for Introducing Educational Robotics and Storytelling in Therapeutical Activities for Children with Neurodevelopmental Disorders," Machines, vol. 11, 2023. DOI: 10.3390/machines11060629
- I. Velasco, A. Sipols, C. Simon De Blas, L. Pastor and S. Bayona "Motor imagery EEG signal classification with a multivariate time series approach," BioMedical Engineering Online, vol. 22, pp. 29, December 2023. DOI: 10.1186/s12938-023-01079-x
- David Mendez-Encinas, Aaron Sujar, Sofia Bayona and David Delgado-Gomez "Attention and impulsivity assessment using virtual reality games," Scientific Reports, vol. 13, pp. 13689, August 2023. DOI: 10.1038/s41598-023-40455-4
- Aarón Sújar, Marina Martín-Moratinos, María Rodrigo-Yanguas, Marcos Bella-Fernández, Carlos González-Tardón, David Delgado-Gómez and Hilario Blasco-Fontecilla "Developing Serious Video Games to Treat Attention Deficit Hyperactivity Disorder: Tutorial Guide," JMIR Serious Games, vol. 10, pp. e33884, August 2022. DOI: 10.2196/33884
An exhaustive list of publications can be found
here
People
-

Óscar David Robles Sánchez
Faculty. ETSII-URJC, CCS.
-

Pablo Toharia
Faculty. ETSIINF-UPM, CCS.
-

Juan Pedro Brito Méndez
Postdoctoral researcher. CCS
-

Francisco González de Quevedo
Project Manager. URJC
-

José Miguel Espadero
System admin. URJC.
-

Aaron Sujar Garrido
Assistant Professor
-

Cristian Rodíguez Bernal
PhD Student. URJC
-

Gonzalo Bayo Martínez
PhD Student.URJC
-

Isabel Vidaurre
PhD Student. URJC
-

Cosmin Toader
PhD Student. URJC
-

Iván Velasco
PhD Student. URJC
-

Sergio E. Galindo Ruedas
PostDoctoral external collaborator
-

Juan José García Cantero
PostDoctoral external collaborator


